Weekly Investment Insights

Deep Dive into Labor Market Indicators for Clues to Fed Actions

June 9, 2025

Key Takeaways:

  • Labor Market Indicators
  • Demand for workers weakening.
  • Job openings stable; layoffs increasing.
  • Low quits rate suggests employees less confident to find new job.
  • Small business owners hiring plans slowing.
  • Fed rate cuts to be a 2H25 story despite early signs of softening labor market.

Deep Dive into Labor Market Indicators for Clues to Fed Actions

We realize that many investors are questioning when the Federal Reserve will be able to resume their interest rate cuts. It is important to understand that the Fed has a dual mandate, price stability and maximum employment. While we are approaching price stability with headline inflation (CPI YoY) decelerating from a 9.1% annual growth rate to 2.3%, it still remains slightly above the Fed’s target. In addition, there are upside risks with the ongoing tariff uncertainty. This has justified the Fed maintaining a wait and see approach. As we look to the labor market, it has been surprisingly resilient.

However, last week we received a variety of data on the labor market that could suggest the Fed may be able to resume interest rate cuts in 2H25. In this weekly insights, we offer a better look into the labor market given the indicators we received last week.

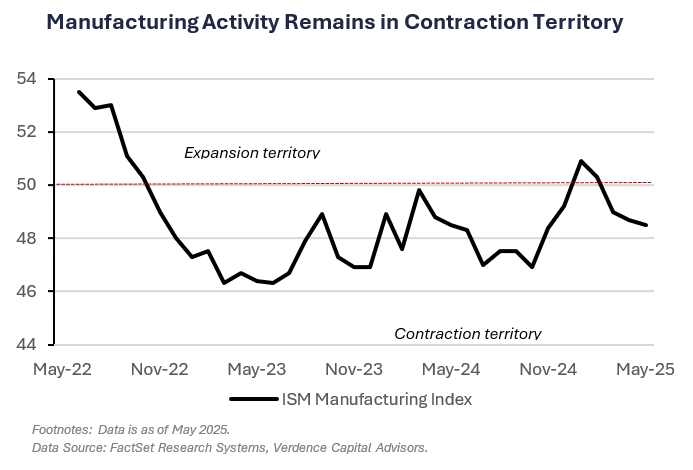
  • ISM surveys show weak demand for workers: In both the ISM Manufacturing and Services Index, the employment component indicated the unemployment rate may increase from current levels. The ISM Manufacturing employment component remained in contraction territory (a reading below 50) for the 26th month out of the past 29 months. While services employment edged slightly into expansion territory in May, respondents to both surveys indicated tariff-related uncertainty and cost management efforts as key reasons for a broad easing in demand for workers.
  • Job openings stable, but underlying data softening: The April JOLTS report indicated job openings remained relatively stable despite economic and tariff-related uncertainty. However, the difference between job postings and those unemployed has narrowed substantially (from 6.2 million more job postings than those unemployed to 225K more job postings). This suggests the labor market is normalizing and the economy is weakening so employers are reducing job postings. In addition, layoffs increased to the highest level in six months. The quits rate (i.e., those who have voluntarily left their jobs) ticked lower for the first time in five months in April suggesting workers are less confident in quitting their job and easily finding a new one.
  • Small businesses impacted: According to the most recent data from the NFIB, small business hiring plans remain historically low. Small businesses accounted for ~60% of total net job creation from 2013 – 2023.1 The most recent hiring plans registered a reading of 13, which is less than the trailing 12-month average (15). Since 1973, when this reading is between 10-15, our analysis shows the average unemployment rate (currently at 4.2%) is ~5.5%, suggesting there may be more deterioration in the labor market to come.

The Bottom Line

We think with the recent labor market data, the slowing in the economy and progress on inflation the Fed will be able to resume rate cuts at their September meeting. However, we expect any rate cuts to be delivered with a “hawkish” rhetoric. With inflation improving but not at the Fed’s target and upside risks to inflation due to tariff related uncertainty, the Fed must walk a fine line. They need to articulate that they prefer a wait and see approach as opposed to a stop and go approach.

READ MORE: Economic Impact of Tariffs

Your Economic and Market Detailed Recaps

  • Manufacturing activity contracts for third straight month.
  • Job openings unexpectedly increase.
  • S. economy adds more jobs than expected.
  • Global equities rally on U.S./China trade optimism.
  • Yields move higher as risk appetite increases.
  • Commodities rally on crude oil strength.

Weekly Economic Recap — Labor Market Remains Resilient, but Weakness Emerging

Manufacturing activity in the U.S. contracted for a third straight month in May as the ISM Manufacturing Endex registered a reading below 50 (48.5). A gauge of imports fell to a 16-year low as firms pulled back amid tariffs. Exports fell to the lowest level in five years.

Economic activity in the services sector unexpectedly contracted in May for the first time since June 2024. Business activity registered the weakest reading in nearly five years. New orders contracted and prices paid increased driven by tariffs.

Job openings unexpectedly increased in April to 7.39 million, from a revised 7.2 million in March. The advance was driven by private-sector industries, including professional/business services and health care. Hiring advanced to the highest level in nearly a year, while the number of layoffs climbed to the highest since October. The quits rate dipped to 2% (from 2.1%) as workers seem less confident in their ability to find a new job.

WATCH NOW: Alternate View Podcast

The U.S. trade deficit narrowed in April by the most on record. The gap in goods and services trade plummeted 55.5% from the prior month, the smallest since 2023. Imports of goods and serviced declined a record 16.3% in April while exports increased 3%.

The U.S. added 139K new jobs in May which was slightly more than anticipated but the prior two months were revised lower by 95K jobs. The unemployment rate remained unchanged as both the labor force declined and household employment fell.

Weekly Market Recap — Global Equities Move Higher as Investors Parse Through Data

Equities:

The MSCI AC World Index was higher for the second consecutive week. Investors saw the weak economic data in the U.S. as sign the Fed can start cutting interest rates again. All the major global averages rallied with the exception of Japan. The U.S. led the rally, specifically in the small and midcap space. The Russell 2000 Index rose the most and was higher for the eighth time in the last nine weeks. Shares in China were also higher last week after a late-week phone call between President Trump and Xi gave investors hope for continued tariff talks.

Fixed Income:

The Bloomberg Aggregate Index was lower for the fifth time in the last six weeks as U.S. Treasury yields rose. The only areas of fixed income that were positive last week were high yield and emerging market.

Commodities/FX:

The Bloomberg Commodity Index was higher by the most since January. Crude oil prices were higher by the most since November as investors digested positive developments from talks between President Trump and Xi. Soft commodities were also sharply higher driven by coffee prices, on weather and tariff-related concerns.

labor market federal reserve


Data is as of April 2025.
Source: FactSet Research Systems, Verdence Capital Advisors

Disclaimer: © Verdence Capital Advisors, LLC

Reproduction without permission is not permitted. The indexes presented are unmanaged portfolios of specified securities and do not reflect any initial or ongoing expenses nor can it be invested in directly. An investment’s portfolio may differ significantly from the securities in the index.  This material was prepared by Verdence Capital Advisors, LLC (“VCA” or “we”, “our”, “us”). VCA believes the information and data in this document were obtained from sources considered reliable and correct and cannot guarantee either their accuracy or completeness. VCA has not independently verified third-party sourced information and data. Any projections, outlooks or assumptions should not be construed to be indicative of the actual events which will occur. These projections, market outlooks or estimates are subject to change without notice. This material is being provided for informational purposes only and is not intended to provide, and should not be relied upon for, investment, accounting, legal, or tax advice. Past performance is not a guarantee of future results. Different types of investments involve varying degrees of risk, and there can be no assurance that the future performance of any specific investment, investment strategy, or product or any non-investment related content, made reference to directly or indirectly in these materials will be profitable, equal any corresponding indicated historical performance level(s), be suitable for your portfolio or individual situation, or prove successful. You should not assume that any discussion or information contained in this report serves as the receipt of, or as a substitute for, personalized investment advice from VCA. Alternative investments are designed only for sophisticated investors who are able to bear the risk of the loss of their entire investment. Investing in alternative investments should be viewed as illiquid and generally not readily marketable or transferable. Investors should be prepared to bear the financial risks of investing in an alternative investment for an indefinite period of time. Due to various factors, including changing market conditions and/or applicable laws, the content may no longer be reflective of current opinions or positions. All indexes are unmanaged, and you cannot invest directly in an index. Index returns do not include fees or expenses. Sector Watch Use of this website is intended for U.S. residents only. Any recommendation, opinion or advice regarding securities or markets contained in such material does not reflect the views of Verdence Capital, and Verdence Capital does not verify any information included in such material. Verdence Capital assumes no responsibility for any fact, recommendation, opinion, or advice contained in any such research material and expressly disclaims any responsibility for any decisions or for the suitability of any security or transaction based on it. Any decisions you may make to buy, sell, or hold a security based on this research will be entirely your own and not in any way deemed to be endorsed or influenced by or attributed to Verdence Capital. It is understood that, without exception, any order based on such research that is placed for execution is and will be treated as an UNRECOMMENDED AND UNSOLICITED ORDER. Further, Verdence Capital assumes no responsibility for the accuracy, completeness, or timeliness of any such research or for updating such research, which is subject to change without notice at any time. Verdence Capital does not provide tax, or legal advice. Under no circumstance is the information contained within this research to be used or considered as an offer to sell or a solicitation of an offer to buy any particular investment/security. Fixed income securities are subject to increased loss of principal during periods of rising interest rates. Fixed income investments are subject to various other risks including changes in credit quality, market valuations, liquidity, prepayments, early redemption, corporate events, tax ramifications and other factors. Lower rated securities are subject to greater credit risk, default risk, and liquidity risk. Commodity‐related products, including futures, carry a high level of risk and are not suitable for all investors. Commodity‐related products may be extremely volatile, illiquid and can be significantly affected by underlying commodity prices, world events, import controls, worldwide competition, government regulations, and economic conditions, regardless of the length of time shares are held. Data is provided for information purposes only and is not intended for trading purposes. Verdence Capital shall not be liable for any errors or delay in the content, or for any action taken in reliance on any content. Weekly Insights/Qtrly & Annual Outlook The indexes presented are unmanaged portfolios of specified securities and do not reflect any initial or ongoing expenses nor can it be invested in directly. An investment’s portfolio may differ significantly from the securities in the index. Semi-Annual Chart Pack Where shown, performance information presented is that which has been calculated and presented by an unaffiliated third-party manager. We have no insight into the performance of the advisor/product/account or fund shown and do not attempt to determine whether the performance presented is accurate. Therefore, the performance could be incorrect, overstated or not reflective of actual trading of client funds. There is the potential that the performance shown is a back test and not the result of real investment advice and trading. As such, it could not be relied upon as indicative of future returns of a particular strategy. Where performance shown is that of a pooled account, limited partnership, or private equity fund, you should be aware that there is a significant lack of transparency into the operations and investment process and investment vehicles invested in. As a result, pricing and valuation of the underlying holdings which produced the stated performance could be incorrect, stale, or overstated and therefore the performance figures presented cannot be relied upon. Before investing, we encourage you to request additional information, particularly performance information, of any product that you are considering for your client. You should read, as applicable, the Prospectus, SAI, Composite Disclosure and/or performance disclosure associated with any product that you are considering for investment for your or your client’s. Products shown may have minimum account sizes or minimum investments which may preclude retail and non-high net worth investors from being able to invest in these products. You should be aware that certain LPs may be closed to new investors and therefore your clients may be prevented from investing in these products. Portfolio Implementation and Rationales The SMA Asset Allocation Models do not represent a personalized recommendation of a particular investment strategy to you or your clients. You should not buy or sell an investment without first considering whether it is appropriate for your client’s portfolio. Additionally, you should review and consider any recent market news. All expressions of opinion are subject to change without notice in reaction to shifting market conditions. Data contained herein from third-party providers is obtained from what are considered reliable sources. However, its accuracy, completeness or reliability cannot be guaranteed. Supporting documentation for any claims or statistical information is available upon request. Examples provided are for illustrative purposes only and not intended to be reflective of results you can expect to achieve. Diversification and asset allocation do not ensure a profit and do not protect against losses in declining markets. Any forecasts contained herein are for illustrative purposes only, may be based upon proprietary research and are developed through analysis of historical public data. Investments in growth stocks may experience price volatility due to their sensitivity to market fluctuations and dependence on future earnings expectations. Sector allocation references to market capitalization (“smid cap” or “micro caps” etc.) may be subject to special risks given their characteristic narrow markets, limited financial resources, and less liquid stocks, all of which may cause price volatility. International/global investing can involve special risks, such as political changes and currency fluctuations. These risks are heightened in emerging markets. A significant percentage of the underlying investments in aggressive asset allocation portfolio investments have a higher-than-average risk exposure. You should consider your risk tolerance of each of your clients carefully before choosing such a strategy. An investment with multiple underlying investments (which may include asset-allocation or custom blended investments) may be subject to the expenses of those underlying investments in addition to those of the investment itself. Investments may reside in the specialty category due to 1) allowable investment flexibility that precludes classification in standard asset categories and/or 2) investment concentration in a limited group of securities or industry sectors. Investments in this category may be more volatile than less flexible and/or less concentrated investments and may be appropriate as only a minor component in an investor’s overall portfolio. Investment Managers You and your clients should carefully consider investment objectives, risks, charges, and expenses of Funds discussed. This and other important information are contained in the respective Fund prospectuses and summary prospectuses, which should be read carefully before investing. Investment portfolio statistics change over time. Current performance may be lower or higher than return data quoted herein. The investment return and the principal value of an investment will fluctuate; so, an investor’s shares/units, when redeemed, may be worth more or less than their original cost. Verdence relies heavily on unaudited third-party data. Data sources include public data, such as mutual fund data, and non-public data, such as information provided by other investment advisors and managers of limited partnership pooled accounts. Data and/or statistics included on this Portal, including references to performance, opinions, ratings, rankings, manager statistics and demographic information, product, or strategy descriptions, either quantitative or qualitative, are based upon information reasonably available to us as of the applicable date(s) then-published. Information has been obtained from sources that we believe to be reliable, but these sources cannot be guaranteed as to their accuracy or completeness. All data and information produced by a third party has the potential to be incorrect, incomplete, or otherwise misleading. No implication shall be created that the information contained on the Site is correct, including as of any time subsequent to the publish date, and Verdence does not undertake an obligation to update such information at any time after such date. Verdence makes not warranty or representation of the veracity of the data and information and its use of the information should not be implied as an endorsement of any material or statements made. Data, particularly non-public data, is subject to error and where the information is not audited, the potential for error is greater. Where shown, performance information presented is that which has been calculated and presented by an unaffiliated third-party manager. We have no insight into the performance of the advisor/product/account or fund shown and do not attempt to determine whether the performance presented is accurate. Therefore, the performance could be incorrect, overstated or not reflective of actual trading of client funds. There is the potential that the performance shown is a back test and not the result of real investment advice and trading. As such, it could not be relied upon as indicative of future returns of a particular strategy. Where performance shown is that of a pooled account, limited partnership, or private equity fund, you should be aware that there is a significant lack of transparency into the operations and investment process and investment vehicles invested in. As a result, pricing and valuation of the underlying holdings which produced the stated performance could be incorrect, stale, or overstated and therefore the performance figures presented cannot be relied upon. Before investing, we encourage you to request additional information, particularly performance information, of any product that you are considering for your client. You should read, as applicable, the Prospectus, SAI, Composite Disclosure and/or performance disclosure associated with any product that you are considering for investment for your or your client’s. Certain products shown may have account minimums or minimum investment sizes that are unattainable for your clients and therefore they may not be eligible to invest in these products. Reference to registration with the Securities and Exchange Commission (“SEC”) does not imply that the SEC has endorsed or approved the qualifications of Verdence or its respective representatives to provide any advisory services described on the Site.

Read more