Weekly Investment Insights

April 2025 Market Recap – April Storm for the U.S.

May 5, 2025

Key Takeaways:

  • U.S. GDP contracts for first time since 2022.
  • U.S. labor market remains resilient.
  • U.S. equities lag the rest of the world.
  • Central banks to be challenged amid trade tensions.
  • Commodities weaker on demand expectations.

April 2025 Market Recap – April Storm for the U.S.

Last week, the International Monetary Fund (IMF) slashed 2025 global growth forecasts to 2.8% (from 3.3% estimate in January). It’s well below the historical (2000 – 2019) average of 3.7%.1 This would mark the slowest expansion of global GDP since the Covid pandemic (in 2020). According to the report, the revision lower was attributed to “a greater amount of policy uncertainty, trade tensions, and expected softer demand momentum.” Global headline inflation is expected to moderate to 4.3% in 2025. Which is slightly higher than the 4.2% estimate from January. This week, we dive deeper into the IMF report and highlight key factors that caused the downgrade in growth.

LISTEN NOW: Markets With Megan Podcast

The April storm that blanketed U.S. equity markets began on “Liberation Day” (April 2). Trump’s aggressive plan for tariffs sent volatility as measured by the VIX Index to levels not seen since the COVID pandemic. The uncertainty spread to Treasuries with the 10YR U.S. Treasury yield rising 50 bps in a week and the U.S. Dollar fell to the lowest level since March 2022. President Trump put a pause on tariffs but the damage was seen in confidence about the future of the U.S. economy. In this weekly insights, we offer an overview of the month of April from an economic and asset class perspective.    

  • U.S. GDP contracts: The first reading of 1Q25 GDP showed the U.S. economy declined for the first time since 2022 due to a surge in imports. In addition, consumer spending grew at the slowest pace in seven quarters.
  • Labor market resilient: The U.S. economy added 177K jobs in April and the unemployment rate remained unchanged (at 4.2%).
  • Inflation moderates. Inflation as measured by the Consumer Price Index declined for the first time since 2022. At the core level (ex food and energy) the rise in prices slowed on a year over year basis (to 2.4% from 2.8%).
  • Consumers getting ahead of tariffs. Retail sales rose at the fastest pace since January 2023 as consumers rushed to purchase items that may be subject to tariffs (e.g., autos, building materials).
Global Equities – Late month turnaround:

Despite declining more than 10% in the week following “Liberation Day,” the MSCI AC World Index recouped all those losses by month end.

  • U.S. lags the rest of the world: U.S. equities lagged the rest of the world as tariff uncertainty sent the S&P 500 into correction territory (drop of 10% or more) and small and midcap stocks into bear market territory (drop of 20% or more). The MSCI AC World Index excluding the U.S. rallied for the third time in the past four months.
  • Small caps underperform: The Russell 2000 Index lagged the Russell 1000 Index for the fifth consecutive month as tariffs raise the odds of a recession.
Fixed Income – Investors flock to safety:

The Bloomberg Aggregate Index was higher for the fourth straight month, and by the most since December 2023 as yields fell during the month.

  • Repricing inflation expectations: US TIPS and floating rate instruments led performance for the asset class as investors reprice inflation expectations.
  • Municipal bonds underperform: Municipal bonds fell for the second straight month amid higher issuance and increased selling to fund tax payments.
Commodities – Recession risk hits commodities:

The Bloomberg Commodity Index declined by the most since May 2023 as Trump’s tariff announcement raises the risk of a recession in the U.S.

  • Energy leads the weakness: The Bloomberg Commodity Energy Index fell by the most since September 2022.
  • Gold rallies: Gold prices hit a new record high due to the flight to safety, weakness in the dollar and volatility in equities.

Your Economic and Market Detailed Recaps

  • Home price gains moderating.
  • Consumer confidence continues to weaken.
  • Labor market resilient despite uncertainty.
  • Global equites higher again; U.S. tech leads rally.
  • Yields whipsawed by economic data.
  • Commodities lower driven by softs underperformance.

Weekly Economic Recap — Consumer Confidence Falls Further While Labor Market is Resilient.

Home prices as measured by the S&P CoreLogic Index rose 0.4% in February while the year over year gains moderated from the prior month (4.5% vs. 4.7%). The monthly gains were led by Boston, New York and Washington DC. The only regions to see prices drop were San Francisco and Cleveland.

Job openings as measured by the monthly JOLTS report showed job openings dropped to the lowest level in five months (7.19 million). The quits rate, those leaving their jobs voluntarily, rose to an eight month high.

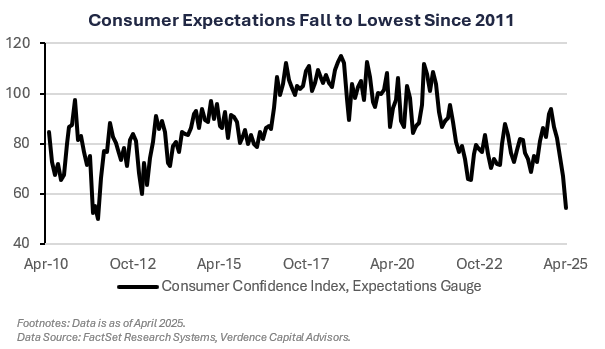
Consumer confidence as measured by the Conference Board fell to the lowest level since January 2021 in March. The expectations component fell to the lowest level since 2011. One year ahead inflation expectations rose to the highest level since 2022 (7.0%).

The ISM Manufacturing Index showed that manufacturing dipped further into contraction territory in April (a reading below 50). The weakness was led by production, new export orders and imports. Prices paid, an inflation indicator, rose for the fifth consecutive month to the highest level since 2022.

LISTEN IN: Alternate View Podcast

The U.S. economy added more jobs than expected in April (177K vs. 138K estimate). However, the prior two months saw 58K jobs fewer than originally reported. The unemployment rate remained unchanged at 4.2%. The healthcare sector led the job gains along with trade jobs. Federal government jobs dropped for the third consecutive month. Average hourly earnings rose slightly less than expected (0.2% MoM vs. 0.3% estimate). As a result, earnings are growing 3.8% on an annual basis.

Weekly Market Recap — Global Equities Surge on Easing Trade Tensions; Tech Leads Rally

Equities:

The MSCI AC World Index was higher for the fourth straight week as global trade tensions continued to ease. The returns were broad based with all the major regions higher for the week. Within the U.S. equity market, the S&P 500 recouped all the losses from April’s “Liberation Day.” In addition, growth outperformed value as mega-cap tech earnings were better-than-expected. Small caps as tracked by the Russell 2000 also rallied and were higher for the fourth straight week.

Fixed Income:

The Bloomberg Aggregate Index was modestly lower last week as yields fluctuated from a plethora of economic data, including GDP data that showed a contracting U.S. economy in 1Q25, and a better-than-expected jobs report. Municipal bonds led the rally in fixed income and were higher for the third straight week.

Commodities/FX:

The Bloomberg Commodity Index was lower for the second consecutive week. Soft commodities led weakness, driven by sugar futures, on increased supply prospects. Crude oil prices plummeted on reports OPEC+ would be deliberating on increasing oil output. Gold prices fell for the second consecutive week on easing global trade tensions and better-than-expected labor market data.


April 2025 market recap


Data is as of April 2025.
Source: FactSet Research Systems, Verdence Capital Advisors

Disclaimer: © Verdence Capital Advisors, LLC

Reproduction without permission is not permitted. The indexes presented are unmanaged portfolios of specified securities and do not reflect any initial or ongoing expenses nor can it be invested in directly. An investment’s portfolio may differ significantly from the securities in the index.  This material was prepared by Verdence Capital Advisors, LLC (“VCA” or “we”, “our”, “us”). VCA believes the information and data in this document were obtained from sources considered reliable and correct and cannot guarantee either their accuracy or completeness. VCA has not independently verified third-party sourced information and data. Any projections, outlooks or assumptions should not be construed to be indicative of the actual events which will occur. These projections, market outlooks or estimates are subject to change without notice. This material is being provided for informational purposes only and is not intended to provide, and should not be relied upon for, investment, accounting, legal, or tax advice. Past performance is not a guarantee of future results. Different types of investments involve varying degrees of risk, and there can be no assurance that the future performance of any specific investment, investment strategy, or product or any non-investment related content, made reference to directly or indirectly in these materials will be profitable, equal any corresponding indicated historical performance level(s), be suitable for your portfolio or individual situation, or prove successful. You should not assume that any discussion or information contained in this report serves as the receipt of, or as a substitute for, personalized investment advice from VCA. Alternative investments are designed only for sophisticated investors who are able to bear the risk of the loss of their entire investment. Investing in alternative investments should be viewed as illiquid and generally not readily marketable or transferable. Investors should be prepared to bear the financial risks of investing in an alternative investment for an indefinite period of time. Due to various factors, including changing market conditions and/or applicable laws, the content may no longer be reflective of current opinions or positions. All indexes are unmanaged, and you cannot invest directly in an index. Index returns do not include fees or expenses. Sector Watch Use of this website is intended for U.S. residents only. Any recommendation, opinion or advice regarding securities or markets contained in such material does not reflect the views of Verdence Capital, and Verdence Capital does not verify any information included in such material. Verdence Capital assumes no responsibility for any fact, recommendation, opinion, or advice contained in any such research material and expressly disclaims any responsibility for any decisions or for the suitability of any security or transaction based on it. Any decisions you may make to buy, sell, or hold a security based on this research will be entirely your own and not in any way deemed to be endorsed or influenced by or attributed to Verdence Capital. It is understood that, without exception, any order based on such research that is placed for execution is and will be treated as an UNRECOMMENDED AND UNSOLICITED ORDER. Further, Verdence Capital assumes no responsibility for the accuracy, completeness, or timeliness of any such research or for updating such research, which is subject to change without notice at any time. Verdence Capital does not provide tax, or legal advice. Under no circumstance is the information contained within this research to be used or considered as an offer to sell or a solicitation of an offer to buy any particular investment/security. Fixed income securities are subject to increased loss of principal during periods of rising interest rates. Fixed income investments are subject to various other risks including changes in credit quality, market valuations, liquidity, prepayments, early redemption, corporate events, tax ramifications and other factors. Lower rated securities are subject to greater credit risk, default risk, and liquidity risk. Commodity‐related products, including futures, carry a high level of risk and are not suitable for all investors. Commodity‐related products may be extremely volatile, illiquid and can be significantly affected by underlying commodity prices, world events, import controls, worldwide competition, government regulations, and economic conditions, regardless of the length of time shares are held. Data is provided for information purposes only and is not intended for trading purposes. Verdence Capital shall not be liable for any errors or delay in the content, or for any action taken in reliance on any content. Weekly Insights/Qtrly & Annual Outlook The indexes presented are unmanaged portfolios of specified securities and do not reflect any initial or ongoing expenses nor can it be invested in directly. An investment’s portfolio may differ significantly from the securities in the index. Semi-Annual Chart Pack Where shown, performance information presented is that which has been calculated and presented by an unaffiliated third-party manager. We have no insight into the performance of the advisor/product/account or fund shown and do not attempt to determine whether the performance presented is accurate. Therefore, the performance could be incorrect, overstated or not reflective of actual trading of client funds. There is the potential that the performance shown is a back test and not the result of real investment advice and trading. As such, it could not be relied upon as indicative of future returns of a particular strategy. Where performance shown is that of a pooled account, limited partnership, or private equity fund, you should be aware that there is a significant lack of transparency into the operations and investment process and investment vehicles invested in. As a result, pricing and valuation of the underlying holdings which produced the stated performance could be incorrect, stale, or overstated and therefore the performance figures presented cannot be relied upon. Before investing, we encourage you to request additional information, particularly performance information, of any product that you are considering for your client. You should read, as applicable, the Prospectus, SAI, Composite Disclosure and/or performance disclosure associated with any product that you are considering for investment for your or your client’s. Products shown may have minimum account sizes or minimum investments which may preclude retail and non-high net worth investors from being able to invest in these products. You should be aware that certain LPs may be closed to new investors and therefore your clients may be prevented from investing in these products. Portfolio Implementation and Rationales The SMA Asset Allocation Models do not represent a personalized recommendation of a particular investment strategy to you or your clients. You should not buy or sell an investment without first considering whether it is appropriate for your client’s portfolio. Additionally, you should review and consider any recent market news. All expressions of opinion are subject to change without notice in reaction to shifting market conditions. Data contained herein from third-party providers is obtained from what are considered reliable sources. However, its accuracy, completeness or reliability cannot be guaranteed. Supporting documentation for any claims or statistical information is available upon request. Examples provided are for illustrative purposes only and not intended to be reflective of results you can expect to achieve. Diversification and asset allocation do not ensure a profit and do not protect against losses in declining markets. Any forecasts contained herein are for illustrative purposes only, may be based upon proprietary research and are developed through analysis of historical public data. Investments in growth stocks may experience price volatility due to their sensitivity to market fluctuations and dependence on future earnings expectations. Sector allocation references to market capitalization (“smid cap” or “micro caps” etc.) may be subject to special risks given their characteristic narrow markets, limited financial resources, and less liquid stocks, all of which may cause price volatility. International/global investing can involve special risks, such as political changes and currency fluctuations. These risks are heightened in emerging markets. A significant percentage of the underlying investments in aggressive asset allocation portfolio investments have a higher-than-average risk exposure. You should consider your risk tolerance of each of your clients carefully before choosing such a strategy. An investment with multiple underlying investments (which may include asset-allocation or custom blended investments) may be subject to the expenses of those underlying investments in addition to those of the investment itself. Investments may reside in the specialty category due to 1) allowable investment flexibility that precludes classification in standard asset categories and/or 2) investment concentration in a limited group of securities or industry sectors. Investments in this category may be more volatile than less flexible and/or less concentrated investments and may be appropriate as only a minor component in an investor’s overall portfolio. Investment Managers You and your clients should carefully consider investment objectives, risks, charges, and expenses of Funds discussed. This and other important information are contained in the respective Fund prospectuses and summary prospectuses, which should be read carefully before investing. Investment portfolio statistics change over time. Current performance may be lower or higher than return data quoted herein. The investment return and the principal value of an investment will fluctuate; so, an investor’s shares/units, when redeemed, may be worth more or less than their original cost. Verdence relies heavily on unaudited third-party data. Data sources include public data, such as mutual fund data, and non-public data, such as information provided by other investment advisors and managers of limited partnership pooled accounts. Data and/or statistics included on this Portal, including references to performance, opinions, ratings, rankings, manager statistics and demographic information, product, or strategy descriptions, either quantitative or qualitative, are based upon information reasonably available to us as of the applicable date(s) then-published. Information has been obtained from sources that we believe to be reliable, but these sources cannot be guaranteed as to their accuracy or completeness. All data and information produced by a third party has the potential to be incorrect, incomplete, or otherwise misleading. No implication shall be created that the information contained on the Site is correct, including as of any time subsequent to the publish date, and Verdence does not undertake an obligation to update such information at any time after such date. Verdence makes not warranty or representation of the veracity of the data and information and its use of the information should not be implied as an endorsement of any material or statements made. Data, particularly non-public data, is subject to error and where the information is not audited, the potential for error is greater. Where shown, performance information presented is that which has been calculated and presented by an unaffiliated third-party manager. We have no insight into the performance of the advisor/product/account or fund shown and do not attempt to determine whether the performance presented is accurate. Therefore, the performance could be incorrect, overstated or not reflective of actual trading of client funds. There is the potential that the performance shown is a back test and not the result of real investment advice and trading. As such, it could not be relied upon as indicative of future returns of a particular strategy. Where performance shown is that of a pooled account, limited partnership, or private equity fund, you should be aware that there is a significant lack of transparency into the operations and investment process and investment vehicles invested in. As a result, pricing and valuation of the underlying holdings which produced the stated performance could be incorrect, stale, or overstated and therefore the performance figures presented cannot be relied upon. Before investing, we encourage you to request additional information, particularly performance information, of any product that you are considering for your client. You should read, as applicable, the Prospectus, SAI, Composite Disclosure and/or performance disclosure associated with any product that you are considering for investment for your or your client’s. Certain products shown may have account minimums or minimum investment sizes that are unattainable for your clients and therefore they may not be eligible to invest in these products. Reference to registration with the Securities and Exchange Commission (“SEC”) does not imply that the SEC has endorsed or approved the qualifications of Verdence or its respective representatives to provide any advisory services described on the Site.

Read more