Weekly Investment Insights

Economic Growth Forecasts Slashed

April 29, 2025

Key Takeaways:

  • IMF cuts global economic growth forecast citing global trade tensions.
  • S. sees 0.9% cut to 2025 GDP estimate from January.
  • Eurozone sees smaller cuts supported by economic growth in Spain.
  • Central banks to be challenged amid trade tensions.
  • Clear and concise negotiations will be beneficial to growth.

Economic Growth Forecasts Slashed

Last week, the International Monetary Fund (IMF) slashed 2025 global growth forecasts to 2.8% (from 3.3% estimate in January). It’s well below the historical (2000 – 2019) average of 3.7%.1 This would mark the slowest expansion of global GDP since the Covid pandemic (in 2020). According to the report, the revision lower was  attributed to “a greater amount of policy uncertainty, trade tensions, and expected softer demand momentum.” Global headline inflation is expected to moderate to 4.3% in 2025. Which is slightly higher than the 4.2% estimate from January. This week, we dive deeper into the IMF report and highlight key factors that caused the downgrade in growth.

  • Tariffs driving the growth downgrade: The IMF’s World Economic Outlook cited, “[an] escalation of trade tensions and extremely high levels of policy uncertainty are expected to have a significant impact on global economic activity.” If the “Liberation Day” tariffs were excluded from the analysis, global growth would have only been cut by 0.2% to 3.2% in 2025.
  • S. downward revisions: U.S. GDP is expected to grow 1.8% in 2025, a 0.9% reduction from the estimate in January. In addition to trade uncertainty, the IMF added consumer and business sentiment in the U.S. has been more pessimistic. While the organization is not calling for a recession specifically in the U.S., IMF chief economist Pierre-Olivier Gourichas told reporters the IMF views recession odds at 40% (revised up from 25% in Oct. 2024). Inflation expectations increased by 1.0% for 2025 from the January report to 3.0%. The increase signifies a full percentage point above the Federal Reserve’s target as well.
  • Eurozone sees smaller downward revisions: The IMF forecast Euro area GDP would slow to 0.8% in 2025, only 0.2% below the January estimate. A potential increase in real wage growth and more public spending in Germany may be pillars of strength for the region. Spain is expected to grow 2.5% in 2025, the most of all EU countries, bolstered by increased trading capabilities with Eastern European countries.2
  • Central bank challenges: Monetary policy faces many challenges in the year(s) to come, specifically from trade disputes and potential supply-chain disruptions. Inflation expectations have surged, especially in the U.S., forcing the Federal Reserve to weigh their dual mandate of maximum employment and stable prices. The IMF stated, “credibility of the monetary policy framework… and central bank independence, will remain key.”

The Bottom Line:

We agree the global economy faces many challenges, especially with the uncertainty around fiscal, trade and monetary policy.  The trade tensions have the potential to hurt U.S. growth prospects in the near-term. And also force countries to work more constructively to achieve a stable and predictable trade environment. We think volatility in equity markets can continue and be driven by the regular headlines about trade negotiations (both good and bad). For long term investors, weakness should be viewed as potential buying opportunities.


Your Economic and Market Detailed Recaps

  • Leading indicators continue to fall.
  • Durable goods sales surge ahead of tariffs.
  • Consumer sentiment at fourth lowest reading in history.
  • S. equities lead global performance; tech higher.
  • Bond prices rally on fears of economic slowdown.
  • Commodities lower, softs outperform.

Weekly Economic Recap — Consumer Sentiment Remains Historically Low

The Leading Economic Indicators Index fell more than expected in March (-0.7% vs. -0.5% est.). Three components, specifically consumer expectations, stock prices, and new manufacturing orders, were the largest detractors from the index as economic uncertainty jumped.

U.S. business activity slowed to a 16-month low in April according to the preliminary flash PMI reading from S&P Global. Prices charged for goods and services increased at the highest rate in over a year. Manufactured goods linked to tariffs were a leading culprit of price increases. Sentiment among companies about their output over the coming year fell for a third consecutive month, falling to the lowest level since July 2022.

Sales of durable goods (i.e., items meant to last at least three years) surged by the most since July as buyers look to get ahead of tariffs. The increase was led by a 139% increase in nondefense aircraft and parts.

Sales of existing homes in March fell at the fastest monthly pace since November 2022, despite an increase in listings, which were up ~20% from a year ago. Elevated mortgage rates dampened buyer demand. Sales across all regions were lower from February, driven by a sharp decline in the West.

LISTEN IN: Alternate View Podcast

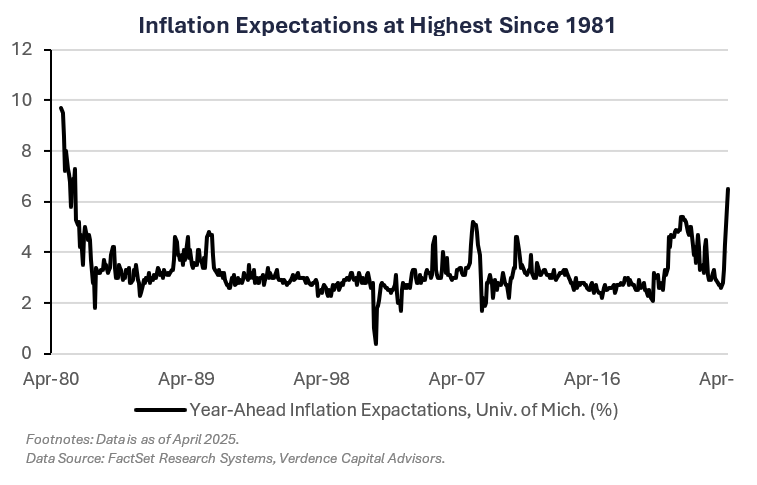
Consumer sentiment fell to its fourth lowest reading in history (52.2) according to the University of Michigan Sentiment Index. Year-ahead inflation expectations sit at 6.5%, the highest since 1981. The expectations gauge fell to the lowest level since 2022 and consumers expected weaker income growth for themselves in the year ahead.

Weekly Market Recap — Global Equities Rally as Trade Tensions Ease; Growth Outperforms

Equities: The MSCI AC World Index was higher for the third straight week supported by reports of trade tensions easing between the U.S. and China. Technology/growth areas of the U.S. market outperformed on the positive trade developments. The tech-heavy Nasdaq led gains, followed by the S&P 500. Small-caps, as tracked by the Russell 2000, were higher for the third straight week.

Fixed Income: The Bloomberg Aggregate Index was higher for the second straight week. Yields on longer-dated maturies fell the most (bond prices higher) on fears of an economic slowdown. All sectors of fixed income markets were higher.

Commodities/FX: The Bloomberg Commodity Index was lower for the first time in three weeks. Crude oil prices were lower on the back of oversupply concerns and continued uncertainty around global tariff negotiations. Gold prices were lower as trade tensions eased. Softs commodities (i.e., agriculture products and livestock) outperformed. However, led by coffee futures on weather and transportation concerns.

Growth Forecasts


Data is as of April 2025.
Source: FactSet Research Systems, Verdence Capital Advisors

Disclaimer: © Verdence Capital Advisors, LLC

Reproduction without permission is not permitted. The indexes presented are unmanaged portfolios of specified securities and do not reflect any initial or ongoing expenses nor can it be invested in directly. An investment’s portfolio may differ significantly from the securities in the index.  This material was prepared by Verdence Capital Advisors, LLC (“VCA” or “we”, “our”, “us”). VCA believes the information and data in this document were obtained from sources considered reliable and correct and cannot guarantee either their accuracy or completeness. VCA has not independently verified third-party sourced information and data. Any projections, outlooks or assumptions should not be construed to be indicative of the actual events which will occur. These projections, market outlooks or estimates are subject to change without notice. This material is being provided for informational purposes only and is not intended to provide, and should not be relied upon for, investment, accounting, legal, or tax advice. Past performance is not a guarantee of future results. Different types of investments involve varying degrees of risk, and there can be no assurance that the future performance of any specific investment, investment strategy, or product or any non-investment related content, made reference to directly or indirectly in these materials will be profitable, equal any corresponding indicated historical performance level(s), be suitable for your portfolio or individual situation, or prove successful. You should not assume that any discussion or information contained in this report serves as the receipt of, or as a substitute for, personalized investment advice from VCA. Alternative investments are designed only for sophisticated investors who are able to bear the risk of the loss of their entire investment. Investing in alternative investments should be viewed as illiquid and generally not readily marketable or transferable. Investors should be prepared to bear the financial risks of investing in an alternative investment for an indefinite period of time. Due to various factors, including changing market conditions and/or applicable laws, the content may no longer be reflective of current opinions or positions. All indexes are unmanaged, and you cannot invest directly in an index. Index returns do not include fees or expenses. Sector Watch Use of this website is intended for U.S. residents only. Any recommendation, opinion or advice regarding securities or markets contained in such material does not reflect the views of Verdence Capital, and Verdence Capital does not verify any information included in such material. Verdence Capital assumes no responsibility for any fact, recommendation, opinion, or advice contained in any such research material and expressly disclaims any responsibility for any decisions or for the suitability of any security or transaction based on it. Any decisions you may make to buy, sell, or hold a security based on this research will be entirely your own and not in any way deemed to be endorsed or influenced by or attributed to Verdence Capital. It is understood that, without exception, any order based on such research that is placed for execution is and will be treated as an UNRECOMMENDED AND UNSOLICITED ORDER. Further, Verdence Capital assumes no responsibility for the accuracy, completeness, or timeliness of any such research or for updating such research, which is subject to change without notice at any time. Verdence Capital does not provide tax, or legal advice. Under no circumstance is the information contained within this research to be used or considered as an offer to sell or a solicitation of an offer to buy any particular investment/security. Fixed income securities are subject to increased loss of principal during periods of rising interest rates. Fixed income investments are subject to various other risks including changes in credit quality, market valuations, liquidity, prepayments, early redemption, corporate events, tax ramifications and other factors. Lower rated securities are subject to greater credit risk, default risk, and liquidity risk. Commodity‐related products, including futures, carry a high level of risk and are not suitable for all investors. Commodity‐related products may be extremely volatile, illiquid and can be significantly affected by underlying commodity prices, world events, import controls, worldwide competition, government regulations, and economic conditions, regardless of the length of time shares are held. Data is provided for information purposes only and is not intended for trading purposes. Verdence Capital shall not be liable for any errors or delay in the content, or for any action taken in reliance on any content. Weekly Insights/Qtrly & Annual Outlook The indexes presented are unmanaged portfolios of specified securities and do not reflect any initial or ongoing expenses nor can it be invested in directly. An investment’s portfolio may differ significantly from the securities in the index. Semi-Annual Chart Pack Where shown, performance information presented is that which has been calculated and presented by an unaffiliated third-party manager. We have no insight into the performance of the advisor/product/account or fund shown and do not attempt to determine whether the performance presented is accurate. Therefore, the performance could be incorrect, overstated or not reflective of actual trading of client funds. There is the potential that the performance shown is a back test and not the result of real investment advice and trading. As such, it could not be relied upon as indicative of future returns of a particular strategy. Where performance shown is that of a pooled account, limited partnership, or private equity fund, you should be aware that there is a significant lack of transparency into the operations and investment process and investment vehicles invested in. As a result, pricing and valuation of the underlying holdings which produced the stated performance could be incorrect, stale, or overstated and therefore the performance figures presented cannot be relied upon. Before investing, we encourage you to request additional information, particularly performance information, of any product that you are considering for your client. You should read, as applicable, the Prospectus, SAI, Composite Disclosure and/or performance disclosure associated with any product that you are considering for investment for your or your client’s. Products shown may have minimum account sizes or minimum investments which may preclude retail and non-high net worth investors from being able to invest in these products. You should be aware that certain LPs may be closed to new investors and therefore your clients may be prevented from investing in these products. Portfolio Implementation and Rationales The SMA Asset Allocation Models do not represent a personalized recommendation of a particular investment strategy to you or your clients. You should not buy or sell an investment without first considering whether it is appropriate for your client’s portfolio. Additionally, you should review and consider any recent market news. All expressions of opinion are subject to change without notice in reaction to shifting market conditions. Data contained herein from third-party providers is obtained from what are considered reliable sources. However, its accuracy, completeness or reliability cannot be guaranteed. Supporting documentation for any claims or statistical information is available upon request. Examples provided are for illustrative purposes only and not intended to be reflective of results you can expect to achieve. Diversification and asset allocation do not ensure a profit and do not protect against losses in declining markets. Any forecasts contained herein are for illustrative purposes only, may be based upon proprietary research and are developed through analysis of historical public data. Investments in growth stocks may experience price volatility due to their sensitivity to market fluctuations and dependence on future earnings expectations. Sector allocation references to market capitalization (“smid cap” or “micro caps” etc.) may be subject to special risks given their characteristic narrow markets, limited financial resources, and less liquid stocks, all of which may cause price volatility. International/global investing can involve special risks, such as political changes and currency fluctuations. These risks are heightened in emerging markets. A significant percentage of the underlying investments in aggressive asset allocation portfolio investments have a higher-than-average risk exposure. You should consider your risk tolerance of each of your clients carefully before choosing such a strategy. An investment with multiple underlying investments (which may include asset-allocation or custom blended investments) may be subject to the expenses of those underlying investments in addition to those of the investment itself. Investments may reside in the specialty category due to 1) allowable investment flexibility that precludes classification in standard asset categories and/or 2) investment concentration in a limited group of securities or industry sectors. Investments in this category may be more volatile than less flexible and/or less concentrated investments and may be appropriate as only a minor component in an investor’s overall portfolio. Investment Managers You and your clients should carefully consider investment objectives, risks, charges, and expenses of Funds discussed. This and other important information are contained in the respective Fund prospectuses and summary prospectuses, which should be read carefully before investing. Investment portfolio statistics change over time. Current performance may be lower or higher than return data quoted herein. The investment return and the principal value of an investment will fluctuate; so, an investor’s shares/units, when redeemed, may be worth more or less than their original cost. Verdence relies heavily on unaudited third-party data. Data sources include public data, such as mutual fund data, and non-public data, such as information provided by other investment advisors and managers of limited partnership pooled accounts. Data and/or statistics included on this Portal, including references to performance, opinions, ratings, rankings, manager statistics and demographic information, product, or strategy descriptions, either quantitative or qualitative, are based upon information reasonably available to us as of the applicable date(s) then-published. Information has been obtained from sources that we believe to be reliable, but these sources cannot be guaranteed as to their accuracy or completeness. All data and information produced by a third party has the potential to be incorrect, incomplete, or otherwise misleading. No implication shall be created that the information contained on the Site is correct, including as of any time subsequent to the publish date, and Verdence does not undertake an obligation to update such information at any time after such date. Verdence makes not warranty or representation of the veracity of the data and information and its use of the information should not be implied as an endorsement of any material or statements made. Data, particularly non-public data, is subject to error and where the information is not audited, the potential for error is greater. Where shown, performance information presented is that which has been calculated and presented by an unaffiliated third-party manager. We have no insight into the performance of the advisor/product/account or fund shown and do not attempt to determine whether the performance presented is accurate. Therefore, the performance could be incorrect, overstated or not reflective of actual trading of client funds. There is the potential that the performance shown is a back test and not the result of real investment advice and trading. As such, it could not be relied upon as indicative of future returns of a particular strategy. Where performance shown is that of a pooled account, limited partnership, or private equity fund, you should be aware that there is a significant lack of transparency into the operations and investment process and investment vehicles invested in. As a result, pricing and valuation of the underlying holdings which produced the stated performance could be incorrect, stale, or overstated and therefore the performance figures presented cannot be relied upon. Before investing, we encourage you to request additional information, particularly performance information, of any product that you are considering for your client. You should read, as applicable, the Prospectus, SAI, Composite Disclosure and/or performance disclosure associated with any product that you are considering for investment for your or your client’s. Certain products shown may have account minimums or minimum investment sizes that are unattainable for your clients and therefore they may not be eligible to invest in these products. Reference to registration with the Securities and Exchange Commission (“SEC”) does not imply that the SEC has endorsed or approved the qualifications of Verdence or its respective representatives to provide any advisory services described on the Site.

Read more