Weekly Investment Insights

Economic Update May 2025

June 2, 2025

Key Takeaways:

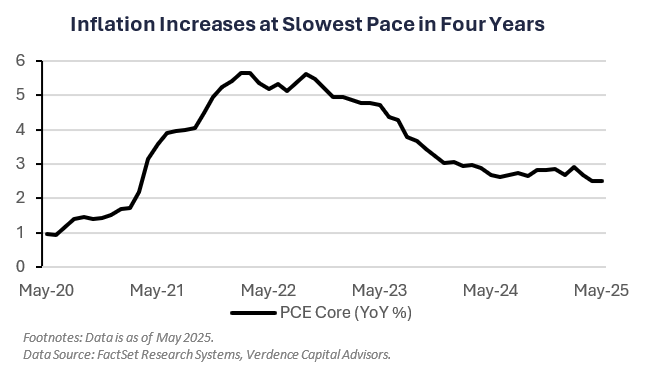
  • Inflation showing some signs of easing.
  • Consumers slow their pace of spending.
  • Global equities rally as investors flock to beaten down growth trade.
  • Bond yields move higher on Moody’s downgrade and heightened uncertainty.
  • Commodities fall for second straight month.
  • Economic Update May 2025

April Showers Brought (Some) May Flowers

The storms of April came and went as May offered equity investors a reprieve from the painful volatility seen the prior month. Global equity markets were higher as tariff-related negotiations accelerated. However, bond markets experienced increased volatility after Moody’s downgrade to the U.S. credit rating and the House passed a fiscal spending package that threatens to worsen the budget deficit. This week we offer a review of the month of May from an economic and asset class perspective.

Inflation showing signs of cooling: The Fed’s preferred inflation gauge, PCE Core, increased at its slowest annualized pace in nearly four years (2.5%) last month and the headline Consumer Price Index increased at its slowest pace since 2021 (2.3%).

• Fed to remain cautious: The Federal Reserve kept interest rates unchanged in May (4.25% – 4.50%) amid elevated risks to inflation and stated that a “cautious approach” to policy is necessary. The uncertainty around tariffs has the Fed in a “wait and see” mode.

• Sentiment weakening: Optimism among small business owners fell to its lowest level since October as tracked by the NFIB. Consumer expectations about the future health of the economy as measured by the University of Michigan Index fell to the lowest level since 1980.

• Consumers slow pace of spending: Inflation-adjusted personal spending increased only 0.1% last month, slower than the 0.7% increase the prior month.

Global Equities:

The MSCI AC World Index was higher by the most since November 2023.

• U.S. leads global performance: U.S. equities outperformed the other developed markets as the S&P 500 was higher than the MSCI EAFE Index for the first time since November 2024.

• Growth back in the spotlight: All “Magnificent 7” components were higher in May, and the Russell 1000 Growth Index outperformed its Value counterpart by the most since December 2024.

Fixed Income – Bond yields rise:

The Bloomberg Aggregate Index was lower for the first time this year as government spending plans and a rating downgrade sent long-term yields higher.

Moody’s downgrade U.S. debt: A U.S. credit rating downgrade sent long term bond yields sharply higher in May. The 10YR and 30YR bond yield rose ~25bps for the month.

• Riskier fixed income sectors outperform: High yield corporate bond prices were higher for the second straight month and by the most since September 2024 as risk appetite was strong.

Commodities – Grains lower on weather forecasts:

The Bloomberg Commodity Index was lower for the second straight month as weakness in soft commodities (e.g. coffee) and grains overshadowed the rally in oil.

• Grains underperform: Grains, such as corn and wheat, were lower in May amid trade dynamics and better supply than expected.

READ MORE: When Bonds Matter

Your Economic and Market Detailed Recaps

  • Consumer confidence surges amid trade optimism.
  • Fed remains uncertain about economic outlook.
  • Fed’s preferred inflation gauge continues to moderate.
  • Global equities higher despite trade uncertainty.
  • Yields fall as investors digest economic data.
  • Crude oil falls on production increase from OPEC+.

Weekly Economic Recap — Inflation Eases Further but Fed to Remain Cautious

Home prices were higher in March according to the S&P Case-Shiller Index, but eased from the prior month. Prices in Cleveland, Seattle, and New York led the gains for the month. The only cities monitored that experienced price declines for the month were Miami and Tampa.

Pending home sales fell at the fastest monthly pace since September 2022 (-6.3%). The share of homes sold that were canceled in the three months through April increased to 7%, the highest since January 2024.

U.S. consumer confidence increased at its fastest monthly pace (+12.3 pts) in four years as optimism broadly improved. The six-month expectations gauge increased by the most since 2011. A larger share of consumers plan to buy large-ticket items, including cars, homes, and major appliances as well.

WATCH NOW: Alternate View Podcast

The Federal Reserve released their May meeting minutes which stated, “participants agreed that uncertainty about the economic outlook had increased further… appropriate to take a cautious approach.” Members marked down their expectations for economic growth in 2025 and 2026 and “almost all” participants noted the risk inflation could prove more persistent than expected.

The U.S. economy contracted less than orignally expected in 1Q25 (-0.2% vs. -0.3%) supported by stronger business investment and a greater accumulation of inventories. Consumer spending increased 1.2% (down from 1.8%), its slowest pace in nearly two years. Net exports subtracted nearly 5 percentage points from the GDP number, the largest on record.

The Fed’s preferred inflation gauge, PCE Core, increased at the slowest annualized pace in four years (2.5%).

Weekly Market Recap — Global Equities Climb; Yields Fall Amid Busy Week of Data

Equities:

The MSCI AC World Index was higher for the second time in the last three weeks. Markets faced volitility, however, as trade uncertainty remained heightened. Major averages in the U.S. were higher for the week but finished off their best levels. Rate sensitive areas led performance, specifically growth/tech; the Nasdaq was the best performing index. European markets were higher after President Trump announced he would give the EU more time to negotiate before 50% tariffs took effect.

Fixed Income:

The Bloomberg Aggregate Index was higher for the first time in five weeks. Investors parsed through the latest Fed minutes and digested a better-than-expected seven-year note auction. Bond yields finished the week generally lower and all sectors of fixed income were higher as a result.

Commodities/FX:

The Bloomberg Commodity Index was lower for the second time in three weeks. Crude oil prices were lower for the second straight week as OPEC+ producers announced plans to increase production. Gold prices were relatively flat as consumer confidence improved and inflation showed signs of easing.

economic update May 2025 moody's downgrade


Data is as of April 2025.
Source: FactSet Research Systems, Verdence Capital Advisors

Disclaimer: © Verdence Capital Advisors, LLC

Reproduction without permission is not permitted. The indexes presented are unmanaged portfolios of specified securities and do not reflect any initial or ongoing expenses nor can it be invested in directly. An investment’s portfolio may differ significantly from the securities in the index.  This material was prepared by Verdence Capital Advisors, LLC (“VCA” or “we”, “our”, “us”). VCA believes the information and data in this document were obtained from sources considered reliable and correct and cannot guarantee either their accuracy or completeness. VCA has not independently verified third-party sourced information and data. Any projections, outlooks or assumptions should not be construed to be indicative of the actual events which will occur. These projections, market outlooks or estimates are subject to change without notice. This material is being provided for informational purposes only and is not intended to provide, and should not be relied upon for, investment, accounting, legal, or tax advice. Past performance is not a guarantee of future results. Different types of investments involve varying degrees of risk, and there can be no assurance that the future performance of any specific investment, investment strategy, or product or any non-investment related content, made reference to directly or indirectly in these materials will be profitable, equal any corresponding indicated historical performance level(s), be suitable for your portfolio or individual situation, or prove successful. You should not assume that any discussion or information contained in this report serves as the receipt of, or as a substitute for, personalized investment advice from VCA. Alternative investments are designed only for sophisticated investors who are able to bear the risk of the loss of their entire investment. Investing in alternative investments should be viewed as illiquid and generally not readily marketable or transferable. Investors should be prepared to bear the financial risks of investing in an alternative investment for an indefinite period of time. Due to various factors, including changing market conditions and/or applicable laws, the content may no longer be reflective of current opinions or positions. All indexes are unmanaged, and you cannot invest directly in an index. Index returns do not include fees or expenses. Sector Watch Use of this website is intended for U.S. residents only. Any recommendation, opinion or advice regarding securities or markets contained in such material does not reflect the views of Verdence Capital, and Verdence Capital does not verify any information included in such material. Verdence Capital assumes no responsibility for any fact, recommendation, opinion, or advice contained in any such research material and expressly disclaims any responsibility for any decisions or for the suitability of any security or transaction based on it. Any decisions you may make to buy, sell, or hold a security based on this research will be entirely your own and not in any way deemed to be endorsed or influenced by or attributed to Verdence Capital. It is understood that, without exception, any order based on such research that is placed for execution is and will be treated as an UNRECOMMENDED AND UNSOLICITED ORDER. Further, Verdence Capital assumes no responsibility for the accuracy, completeness, or timeliness of any such research or for updating such research, which is subject to change without notice at any time. Verdence Capital does not provide tax, or legal advice. Under no circumstance is the information contained within this research to be used or considered as an offer to sell or a solicitation of an offer to buy any particular investment/security. Fixed income securities are subject to increased loss of principal during periods of rising interest rates. Fixed income investments are subject to various other risks including changes in credit quality, market valuations, liquidity, prepayments, early redemption, corporate events, tax ramifications and other factors. Lower rated securities are subject to greater credit risk, default risk, and liquidity risk. Commodity‐related products, including futures, carry a high level of risk and are not suitable for all investors. Commodity‐related products may be extremely volatile, illiquid and can be significantly affected by underlying commodity prices, world events, import controls, worldwide competition, government regulations, and economic conditions, regardless of the length of time shares are held. Data is provided for information purposes only and is not intended for trading purposes. Verdence Capital shall not be liable for any errors or delay in the content, or for any action taken in reliance on any content. Weekly Insights/Qtrly & Annual Outlook The indexes presented are unmanaged portfolios of specified securities and do not reflect any initial or ongoing expenses nor can it be invested in directly. An investment’s portfolio may differ significantly from the securities in the index. Semi-Annual Chart Pack Where shown, performance information presented is that which has been calculated and presented by an unaffiliated third-party manager. We have no insight into the performance of the advisor/product/account or fund shown and do not attempt to determine whether the performance presented is accurate. Therefore, the performance could be incorrect, overstated or not reflective of actual trading of client funds. There is the potential that the performance shown is a back test and not the result of real investment advice and trading. As such, it could not be relied upon as indicative of future returns of a particular strategy. Where performance shown is that of a pooled account, limited partnership, or private equity fund, you should be aware that there is a significant lack of transparency into the operations and investment process and investment vehicles invested in. As a result, pricing and valuation of the underlying holdings which produced the stated performance could be incorrect, stale, or overstated and therefore the performance figures presented cannot be relied upon. Before investing, we encourage you to request additional information, particularly performance information, of any product that you are considering for your client. You should read, as applicable, the Prospectus, SAI, Composite Disclosure and/or performance disclosure associated with any product that you are considering for investment for your or your client’s. Products shown may have minimum account sizes or minimum investments which may preclude retail and non-high net worth investors from being able to invest in these products. You should be aware that certain LPs may be closed to new investors and therefore your clients may be prevented from investing in these products. Portfolio Implementation and Rationales The SMA Asset Allocation Models do not represent a personalized recommendation of a particular investment strategy to you or your clients. You should not buy or sell an investment without first considering whether it is appropriate for your client’s portfolio. Additionally, you should review and consider any recent market news. All expressions of opinion are subject to change without notice in reaction to shifting market conditions. Data contained herein from third-party providers is obtained from what are considered reliable sources. However, its accuracy, completeness or reliability cannot be guaranteed. Supporting documentation for any claims or statistical information is available upon request. Examples provided are for illustrative purposes only and not intended to be reflective of results you can expect to achieve. Diversification and asset allocation do not ensure a profit and do not protect against losses in declining markets. Any forecasts contained herein are for illustrative purposes only, may be based upon proprietary research and are developed through analysis of historical public data. Investments in growth stocks may experience price volatility due to their sensitivity to market fluctuations and dependence on future earnings expectations. Sector allocation references to market capitalization (“smid cap” or “micro caps” etc.) may be subject to special risks given their characteristic narrow markets, limited financial resources, and less liquid stocks, all of which may cause price volatility. International/global investing can involve special risks, such as political changes and currency fluctuations. These risks are heightened in emerging markets. A significant percentage of the underlying investments in aggressive asset allocation portfolio investments have a higher-than-average risk exposure. You should consider your risk tolerance of each of your clients carefully before choosing such a strategy. An investment with multiple underlying investments (which may include asset-allocation or custom blended investments) may be subject to the expenses of those underlying investments in addition to those of the investment itself. Investments may reside in the specialty category due to 1) allowable investment flexibility that precludes classification in standard asset categories and/or 2) investment concentration in a limited group of securities or industry sectors. Investments in this category may be more volatile than less flexible and/or less concentrated investments and may be appropriate as only a minor component in an investor’s overall portfolio. Investment Managers You and your clients should carefully consider investment objectives, risks, charges, and expenses of Funds discussed. This and other important information are contained in the respective Fund prospectuses and summary prospectuses, which should be read carefully before investing. Investment portfolio statistics change over time. Current performance may be lower or higher than return data quoted herein. The investment return and the principal value of an investment will fluctuate; so, an investor’s shares/units, when redeemed, may be worth more or less than their original cost. Verdence relies heavily on unaudited third-party data. Data sources include public data, such as mutual fund data, and non-public data, such as information provided by other investment advisors and managers of limited partnership pooled accounts. Data and/or statistics included on this Portal, including references to performance, opinions, ratings, rankings, manager statistics and demographic information, product, or strategy descriptions, either quantitative or qualitative, are based upon information reasonably available to us as of the applicable date(s) then-published. Information has been obtained from sources that we believe to be reliable, but these sources cannot be guaranteed as to their accuracy or completeness. All data and information produced by a third party has the potential to be incorrect, incomplete, or otherwise misleading. No implication shall be created that the information contained on the Site is correct, including as of any time subsequent to the publish date, and Verdence does not undertake an obligation to update such information at any time after such date. Verdence makes not warranty or representation of the veracity of the data and information and its use of the information should not be implied as an endorsement of any material or statements made. Data, particularly non-public data, is subject to error and where the information is not audited, the potential for error is greater. Where shown, performance information presented is that which has been calculated and presented by an unaffiliated third-party manager. We have no insight into the performance of the advisor/product/account or fund shown and do not attempt to determine whether the performance presented is accurate. Therefore, the performance could be incorrect, overstated or not reflective of actual trading of client funds. There is the potential that the performance shown is a back test and not the result of real investment advice and trading. As such, it could not be relied upon as indicative of future returns of a particular strategy. Where performance shown is that of a pooled account, limited partnership, or private equity fund, you should be aware that there is a significant lack of transparency into the operations and investment process and investment vehicles invested in. As a result, pricing and valuation of the underlying holdings which produced the stated performance could be incorrect, stale, or overstated and therefore the performance figures presented cannot be relied upon. Before investing, we encourage you to request additional information, particularly performance information, of any product that you are considering for your client. You should read, as applicable, the Prospectus, SAI, Composite Disclosure and/or performance disclosure associated with any product that you are considering for investment for your or your client’s. Certain products shown may have account minimums or minimum investment sizes that are unattainable for your clients and therefore they may not be eligible to invest in these products. Reference to registration with the Securities and Exchange Commission (“SEC”) does not imply that the SEC has endorsed or approved the qualifications of Verdence or its respective representatives to provide any advisory services described on the Site.

Read more