Weekly Investment Insights

Taking a Closer Look at Digital Assets – Stablecoins

June 30, 2025

Key Takeaways:

  • U.S. Senate passes first-ever legislation for U.S. Dollar pegged stablecoins.
  • Stablecoins are not cryptocurrencies because they are backed by cash or cash equivalent assets.
  • Stablecoins may prove more efficient than normal cross-border payment systems.
  • Consumers and private companies may adopt stablecoins to cut down on credit card fees.
  • Beware of this highly volatile product at this time.

Taking a Closer Look at Digital Assets – Stablecoins

Stablecoins were introduced in 2014 and have been making headlines recently after the U.S. Senate passed the GENIUS Act on June 17th, 2025. The bill, which establishes the first-ever federal regulations for U.S. Dollar pegged stablecoins, was passed in a rare case of bipartisanship with a 68-30 vote. The bill establishes centralized oversight with the U.S. Treasury and requires issuers to maintain at least a one-to-one reserve backing of safe assets (e.g., US T-Bills or U.S. Dollars). Given the developing headlines we are using this Weekly Insights to provide an overview of the stablecoin market, examine potential consumer benefits, and caution investors about this newly regulated product.

  • What are stablecoins? Stablecoins are a type of digital asset designed to maintain a store of value to a pegged asset, such as the U.S. Dollar. They are not considered cryptocurrencies because issuers of stablecoins hold cash or other cash equivalents that back the digital asset. Stablecoin values do not fluctuate with supply and demand like cryptocurrencies. The total transfer value of stablecoins in 2024 exceeded $27 trillion, greater than Mastercard and Visa transaction volume combined.1
  • Efficiency in cross-border payments: Stablecoins may help facilitate cross-border payments and reduce complexities involved in currency conversion through traditional foreign exchange channels. Currently, international wire transfers can take anywhere between 1-5 business days, and the timing can be impacted by factors, such as time zone differences and currency conversions. International stablecoin transactions can take place in a matter of minutes, making cross-border transactions more time efficient.
  • Cards vs. Coins: Another evolving case in support of stablecoins is in the retail space. When consumers use credit cards to purchase retail goods, the merchants accepting payment have to pay a processing fee, generally ranging from 1.1%-3.15% per transaction.2 In fact, credit card companies earned ~$148 billion from charging these fees in 2024, and the fees (which are passed through to consumers) cost families ~$1,200.2 Stablecoin transaction costs vary depending on the blockchain network, network congestion, and overall transaction speed. While holding stablecoins may have small fees, converting or selling stablecoins can incur additional fees.
The Bottom Line:

Stablecoins are a newly regulated product introducing more questions than answers. While they may be linked to safe investments, the liquidity can be unpredictable. Stablecoins can “break the buck” like a money market mutual fund in times of stress (e.g., Terra in May 2022). Currently, not all stablecoins are backed by Treasuries and investors can be subject to complete loss of capital invested. While stocks linked to the stablecoin market surged after GENIUS Act passed, we would be cautious chasing these securities. The regulation and products are in the infancy stages with a variety of fees, and yields that can be lower than cash. Therefore, we do not recommend these products currently but we will watch the evolution of this market closely.

LISTEN NOW: Markets With Megan


Your Economic and Market Detailed Recaps

  • Consumer confidence deteriorates further.
  • 1Q25 GDP contracts at steeper pace than estimated.
  • Fed’s preferred inflation gauge rises more than expected.
  • Global equities rally on cooling Middle East tensions.
  • Bond yields lower on Fed commentary.
  • Commodities lower after geopolitical tensions ease.

Weekly Economic Recap — Consumer Confidence Slides and Inflation Proving to be Stubborn

U.S. business activity, according to the S&P U.S. PMI Index, expanded in June for the 29th consecutive month. New orders have increased for 14 straight months and contributed the most to growth. Exports of goods and services decreased and weighed on growth as tariffs were widely to blame, according to the survey.

Consumer confidence, as measured by the Conference Board, declined in June. Sentiment on present and future expectations for the economy fell. In addition, the share of consumers that said jobs were plentiful fell to the lowest level in more than four years.

U.S. GDP for 1Q25 contracted at a faster-than-expected pace (-0.5% Q/Q vs. -0.2% Q/Q in prior reading). Consumer spending was revised down to the weakest pace since 2Q20. Initial estimates showed spending on services increased ~0.8% in the first quarter, while the most recent reading showed spending only increased 0.3% Q/Q.

New home sales plummeted in May to an annualized pace of 623K as investors contended with elevated mortgage rates in May. Slower sales led to a surge in supply, climbing to 9.8 months. This represents the highest level of supply since the Fed first started raising rates in the summer of 2022.

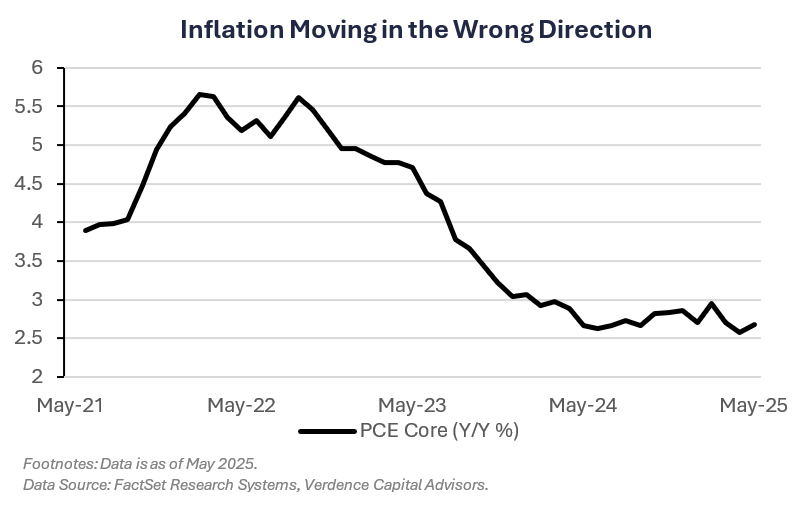
The Fed’s preferred inflation gauge, PCE Core, increased at a faster-than-expected pace in May (2.7% Y/Y vs. 2.6% Y/Y est.). The headline reading increased in line with estimates (2.3% Y/Y) driven by food and shelter prices specifically.

Weekly Market Recap — Global Equities Higher as Geopolitical Tensions Ease

Equities:

The MSCI AC World Index was higher for the first time in three weeks and by the most in in two months as a ceasefire deal between Israel and Iran and positive rhetoric out of U.S. trade negotiations supported risk appetite. The U.S. led in the global equity rally with all major averages higher. The S&P 500 and Nasdaq Index finished at record highs. Equities in Europe were higher bolstered by easing tensions in the Middle East and NATO promising to increase defense spending to 5% of GDP.

Fixed Income:

The Bloomberg Aggregate Index was higher last week as Fed officials suggested rate cuts could be coming in the near future. U.S. Treasury yields were lower across the curve as a result (bond prices and yields move in inverse directions). All sectors of fixed income were higher.

Commodities/FX:

The Bloomberg Aggregate Index was higher last week as Fed officials suggested rate cuts could be coming in the near future. U.S. Treasury yields were lower across the curve as a result (bond prices and yields move in inverse directions). All sectors of fixed income were higher.

WATCH NOW: Alternate View Podcast

stablecoins inflation June 2025


Data is as of May 2025.
Source: FactSet Research Systems, Verdence Capital Advisors

Disclaimer: © Verdence Capital Advisors, LLC

Reproduction without permission is not permitted. The indexes presented are unmanaged portfolios of specified securities and do not reflect any initial or ongoing expenses nor can it be invested in directly. An investment’s portfolio may differ significantly from the securities in the index.  This material was prepared by Verdence Capital Advisors, LLC (“VCA” or “we”, “our”, “us”). VCA believes the information and data in this document were obtained from sources considered reliable and correct and cannot guarantee either their accuracy or completeness. VCA has not independently verified third-party sourced information and data. Any projections, outlooks or assumptions should not be construed to be indicative of the actual events which will occur. These projections, market outlooks or estimates are subject to change without notice. This material is being provided for informational purposes only and is not intended to provide, and should not be relied upon for, investment, accounting, legal, or tax advice. Past performance is not a guarantee of future results. Different types of investments involve varying degrees of risk, and there can be no assurance that the future performance of any specific investment, investment strategy, or product or any non-investment related content, made reference to directly or indirectly in these materials will be profitable, equal any corresponding indicated historical performance level(s), be suitable for your portfolio or individual situation, or prove successful. You should not assume that any discussion or information contained in this report serves as the receipt of, or as a substitute for, personalized investment advice from VCA. Alternative investments are designed only for sophisticated investors who are able to bear the risk of the loss of their entire investment. Investing in alternative investments should be viewed as illiquid and generally not readily marketable or transferable. Investors should be prepared to bear the financial risks of investing in an alternative investment for an indefinite period of time. Due to various factors, including changing market conditions and/or applicable laws, the content may no longer be reflective of current opinions or positions. All indexes are unmanaged, and you cannot invest directly in an index. Index returns do not include fees or expenses. Sector Watch Use of this website is intended for U.S. residents only. Any recommendation, opinion or advice regarding securities or markets contained in such material does not reflect the views of Verdence Capital, and Verdence Capital does not verify any information included in such material. Verdence Capital assumes no responsibility for any fact, recommendation, opinion, or advice contained in any such research material and expressly disclaims any responsibility for any decisions or for the suitability of any security or transaction based on it. Any decisions you may make to buy, sell, or hold a security based on this research will be entirely your own and not in any way deemed to be endorsed or influenced by or attributed to Verdence Capital. It is understood that, without exception, any order based on such research that is placed for execution is and will be treated as an UNRECOMMENDED AND UNSOLICITED ORDER. Further, Verdence Capital assumes no responsibility for the accuracy, completeness, or timeliness of any such research or for updating such research, which is subject to change without notice at any time. Verdence Capital does not provide tax, or legal advice. Under no circumstance is the information contained within this research to be used or considered as an offer to sell or a solicitation of an offer to buy any particular investment/security. Fixed income securities are subject to increased loss of principal during periods of rising interest rates. Fixed income investments are subject to various other risks including changes in credit quality, market valuations, liquidity, prepayments, early redemption, corporate events, tax ramifications and other factors. Lower rated securities are subject to greater credit risk, default risk, and liquidity risk. Commodity‐related products, including futures, carry a high level of risk and are not suitable for all investors. Commodity‐related products may be extremely volatile, illiquid and can be significantly affected by underlying commodity prices, world events, import controls, worldwide competition, government regulations, and economic conditions, regardless of the length of time shares are held. Data is provided for information purposes only and is not intended for trading purposes. Verdence Capital shall not be liable for any errors or delay in the content, or for any action taken in reliance on any content. Weekly Insights/Qtrly & Annual Outlook The indexes presented are unmanaged portfolios of specified securities and do not reflect any initial or ongoing expenses nor can it be invested in directly. An investment’s portfolio may differ significantly from the securities in the index. Semi-Annual Chart Pack Where shown, performance information presented is that which has been calculated and presented by an unaffiliated third-party manager. We have no insight into the performance of the advisor/product/account or fund shown and do not attempt to determine whether the performance presented is accurate. Therefore, the performance could be incorrect, overstated or not reflective of actual trading of client funds. There is the potential that the performance shown is a back test and not the result of real investment advice and trading. As such, it could not be relied upon as indicative of future returns of a particular strategy. Where performance shown is that of a pooled account, limited partnership, or private equity fund, you should be aware that there is a significant lack of transparency into the operations and investment process and investment vehicles invested in. As a result, pricing and valuation of the underlying holdings which produced the stated performance could be incorrect, stale, or overstated and therefore the performance figures presented cannot be relied upon. Before investing, we encourage you to request additional information, particularly performance information, of any product that you are considering for your client. You should read, as applicable, the Prospectus, SAI, Composite Disclosure and/or performance disclosure associated with any product that you are considering for investment for your or your client’s. Products shown may have minimum account sizes or minimum investments which may preclude retail and non-high net worth investors from being able to invest in these products. You should be aware that certain LPs may be closed to new investors and therefore your clients may be prevented from investing in these products. Portfolio Implementation and Rationales The SMA Asset Allocation Models do not represent a personalized recommendation of a particular investment strategy to you or your clients. You should not buy or sell an investment without first considering whether it is appropriate for your client’s portfolio. Additionally, you should review and consider any recent market news. All expressions of opinion are subject to change without notice in reaction to shifting market conditions. Data contained herein from third-party providers is obtained from what are considered reliable sources. However, its accuracy, completeness or reliability cannot be guaranteed. Supporting documentation for any claims or statistical information is available upon request. Examples provided are for illustrative purposes only and not intended to be reflective of results you can expect to achieve. Diversification and asset allocation do not ensure a profit and do not protect against losses in declining markets. Any forecasts contained herein are for illustrative purposes only, may be based upon proprietary research and are developed through analysis of historical public data. Investments in growth stocks may experience price volatility due to their sensitivity to market fluctuations and dependence on future earnings expectations. Sector allocation references to market capitalization (“smid cap” or “micro caps” etc.) may be subject to special risks given their characteristic narrow markets, limited financial resources, and less liquid stocks, all of which may cause price volatility. International/global investing can involve special risks, such as political changes and currency fluctuations. These risks are heightened in emerging markets. A significant percentage of the underlying investments in aggressive asset allocation portfolio investments have a higher-than-average risk exposure. You should consider your risk tolerance of each of your clients carefully before choosing such a strategy. An investment with multiple underlying investments (which may include asset-allocation or custom blended investments) may be subject to the expenses of those underlying investments in addition to those of the investment itself. Investments may reside in the specialty category due to 1) allowable investment flexibility that precludes classification in standard asset categories and/or 2) investment concentration in a limited group of securities or industry sectors. Investments in this category may be more volatile than less flexible and/or less concentrated investments and may be appropriate as only a minor component in an investor’s overall portfolio. Investment Managers You and your clients should carefully consider investment objectives, risks, charges, and expenses of Funds discussed. This and other important information are contained in the respective Fund prospectuses and summary prospectuses, which should be read carefully before investing. Investment portfolio statistics change over time. Current performance may be lower or higher than return data quoted herein. The investment return and the principal value of an investment will fluctuate; so, an investor’s shares/units, when redeemed, may be worth more or less than their original cost. Verdence relies heavily on unaudited third-party data. Data sources include public data, such as mutual fund data, and non-public data, such as information provided by other investment advisors and managers of limited partnership pooled accounts. Data and/or statistics included on this Portal, including references to performance, opinions, ratings, rankings, manager statistics and demographic information, product, or strategy descriptions, either quantitative or qualitative, are based upon information reasonably available to us as of the applicable date(s) then-published. Information has been obtained from sources that we believe to be reliable, but these sources cannot be guaranteed as to their accuracy or completeness. All data and information produced by a third party has the potential to be incorrect, incomplete, or otherwise misleading. No implication shall be created that the information contained on the Site is correct, including as of any time subsequent to the publish date, and Verdence does not undertake an obligation to update such information at any time after such date. Verdence makes not warranty or representation of the veracity of the data and information and its use of the information should not be implied as an endorsement of any material or statements made. Data, particularly non-public data, is subject to error and where the information is not audited, the potential for error is greater. Where shown, performance information presented is that which has been calculated and presented by an unaffiliated third-party manager. We have no insight into the performance of the advisor/product/account or fund shown and do not attempt to determine whether the performance presented is accurate. Therefore, the performance could be incorrect, overstated or not reflective of actual trading of client funds. There is the potential that the performance shown is a back test and not the result of real investment advice and trading. As such, it could not be relied upon as indicative of future returns of a particular strategy. Where performance shown is that of a pooled account, limited partnership, or private equity fund, you should be aware that there is a significant lack of transparency into the operations and investment process and investment vehicles invested in. As a result, pricing and valuation of the underlying holdings which produced the stated performance could be incorrect, stale, or overstated and therefore the performance figures presented cannot be relied upon. Before investing, we encourage you to request additional information, particularly performance information, of any product that you are considering for your client. You should read, as applicable, the Prospectus, SAI, Composite Disclosure and/or performance disclosure associated with any product that you are considering for investment for your or your client’s. Certain products shown may have account minimums or minimum investment sizes that are unattainable for your clients and therefore they may not be eligible to invest in these products. Reference to registration with the Securities and Exchange Commission (“SEC”) does not imply that the SEC has endorsed or approved the qualifications of Verdence or its respective representatives to provide any advisory services described on the Site.

Read more