Weekly Investment Insights

Economic Impact of Tariffs

May 12, 2025

Economic Impact of Tariffs

Tariffs, and the uncertainty, continue to be a leading driver of market moves, basically daily. We have seen headlines impact both hard data (e.g., real data points) and soft data (e.g., survey data, consumer confidence). While the Trump administration works through negotiations on a country-by-country basis, and we received good news regarding the China/U.S. relationship today, tariffs have started to impact economic data in the U.S. This week, we provide an overview of how tariffs have impacted the economy thus far and the potential investment implications moving forward.

LISTEN NOW: Markets With Megan Podcast

Soft data – Businesses cut capex spending:

Regional manufacturing surveys from New York, Philadelphia, Kansas City, and Dallas have all indicated a sharp slowdown in capital expenditure plans. Businesses are reassessing their spending plans amid rising input costs. In fact, one-year inflation expectations according to the New York Fed Survey increased to the highest level since June 2023 in April, citing increased pressures due to tariffs and supply chain disruptions. Higher input costs can shrink corporate margins and cause weaker earnings.

Soft data – Consumer confidence deteriorates:

Both consumer confidence surveys that we monitor, University of Michigan and Conference Board, have seen consumer confidence fall sharply. In fact, future expectations on the economy according to the Conference Board fell to the lowest level since 2011.

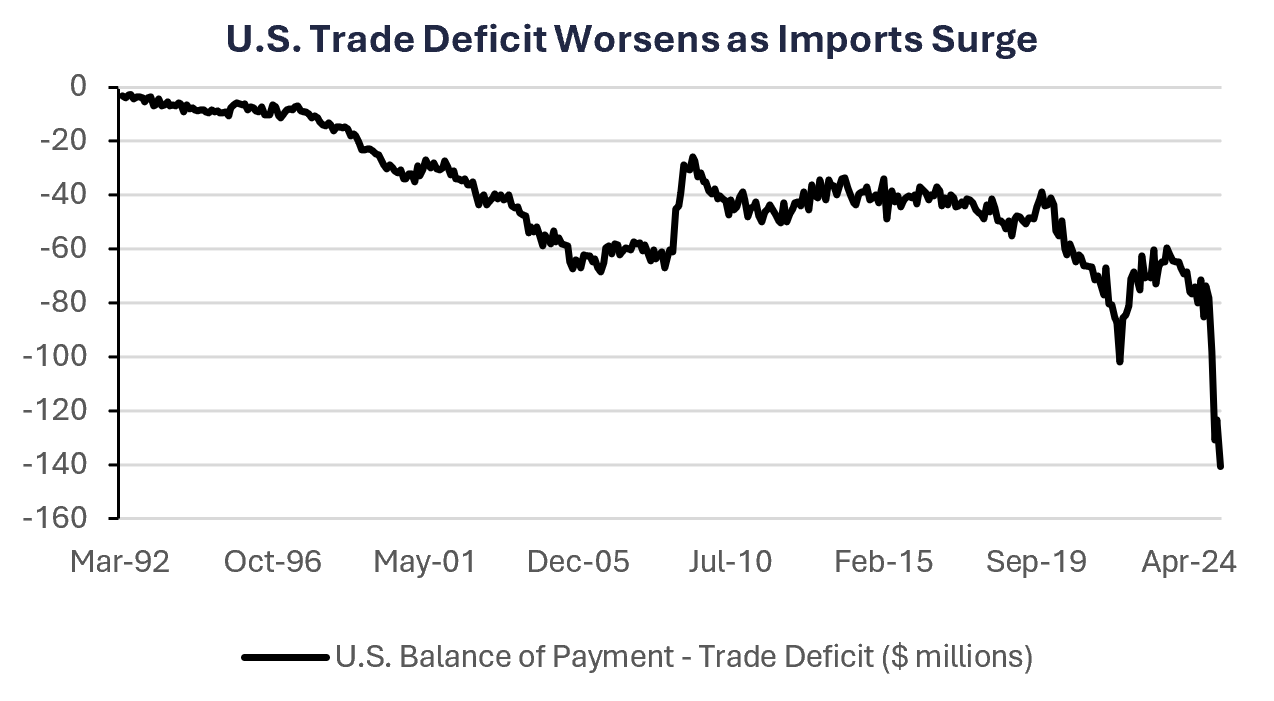
Hard data – International trade impact:

Last week, economic data showed the U.S. trade deficit widened to a record $140.5 billion in March as companies increased imports ahead of tariff plans. Imports in pharmaceuticals saw some of the most significant gains.

Hard data – Inflation pressures higher:

The ISM Services Prices Paid Index currently sits at its highest level since January 2023 (65.1), reflecting elevated input costs in the services sector. Going back to 1999, when the ISM Services Prices Paid Index crosses a reading of 60+, the average PCE reading is higher by ~0.24% and inflation was positive 70% of the time.1 As a result, we see the risk of higher PCE inflation over the next twelve months.

READ MORE: Volatility Surges As Inflation and Weak Data Rattle Investors

Hard data – GDP contraction driven by import surge:

First quarter 2025 GDP declined 0.3% as a surge in imports (which detract from economic activity) weighed on growth. Excluding the impact of net exports (exports – imports), or looking at Final Sales to Domestic Purchasers, demand remained resilient and in line with the historical average (2.2% vs. 2.3% QoQ) over the last 25 years.2

The Bottom Line:

We have just begun seeing the initial impact from the tariff uncertainty show up in survey data. We think economic data will continue to be volatile over the coming months as we navigate through weaker soft data that may filter into hard data. For example, historically, weak consumer confidence has translated into weak consumer spending. In addition, the pull forward of some spending from a consumer and/or business perspective to get ahead of tariffs may not be sustainable. Especially since the situation remains highly fluid. This economic uncertainty should keep volatility in equity and bond markets heightened.


Your Economic and Market Detailed Recaps

  • Service providers see prices increase to a two-year high.
  • U.S. trade deficit widens to largest in history.
  • Fed stresses they are not in a rush to cut rates.
  • Global equities lower for first time in five weeks.
  • Yields higher on positive trade rhetoric.
  • Commodities rally driven by crude oil.

Weekly Economic Recap — Fed Keeps Rates Unchanged but Sees Greater Risks

The U.S. service sector as measured by the ISM Services Index rose in April and remained in expansion territory (a reading above 50) for the 10th consecutive month. The prices-paid component increased to a two-year high of 65.1 with nearly 40% of purchasing managers reporting higher prices, the largest share since November 2022.

The U.S. trade deficit widened to a record in March ($140.5 billion) as companies rushed to import products ahead of Trump’s tariffs. Consumer goods imports climbed by the most on record, primarily driven by the largest-ever inflow of pharmaceutical products.

LISTEN NOW: Alternate View Podcast

The Federal Reserve kept interest rates unchanged at their latest meeting (at 4.25% – 4.5%). The post-meeting statement read, “the risks of higher unemployment and higher inflation have risen.” Fed Chairman Powell reiterated the committee’s stance on remaining heavily reliant on incoming data to drive decisions for interest rates and that “the economy is in a good place… we don’t need to be in a hurry to cut rates.”

Consumer borrowing increased in March by the most in three months driven by an increase in credit-card balances. Total credit climbed $10.2 billion after falling a revised $614 million in February. Non-revolving debt, including loans for vehicle purchases and school tuition, increased $8.3 billion.

The Bank of England cut interest rates by 25 bps last week to 4.25%. The central bank cited uncertainty around tariffs and underwhelming economic growth. The post-meeting press release stated, “[the] prospects for global growth have weakned as a result of [trade policy] uncertainty.”

Weekly Market Recap — Global Equities Fall Amid Trade Rhetoric and Diverging Central Bank Policy

Equities:

The MSCI AC World Index was lower for the first time in five weeks as markets were whipsawed by increased trade rhetoric and diverging central bank policy. In the U.S., the small-cap Russell 2000 was higher for the fifth straight week driven by positive trade negotiation developments. Large-caps as tracked by the S&P 500 were lower for the first time in three weeks. European equities outperformed after a trade deal between the U.S. and U.K. was announced.

Fixed Income:

The Bloomberg Aggregate Index was lower for the second straight week as yields were generally higher amid trade optimism and the Fed’s rate decision. Municipal bonds were higher for the fourth straight week on light issuance. Investment grade corporate bonds were lower for the second straight week.

Commodities/FX:

The Bloomberg Commodity Index was higher for the first time in three weeks. Crude oil prices were higher by the most since January amid positive trade developments. Gold prices dropped on hopes for additional trade negotiations.


Data is as of March 2025.
Source: FactSet Research Systems, Verdence Capital Advisors

Disclaimer: © Verdence Capital Advisors, LLC

Reproduction without permission is not permitted. The indexes presented are unmanaged portfolios of specified securities and do not reflect any initial or ongoing expenses nor can it be invested in directly. An investment’s portfolio may differ significantly from the securities in the index.  This material was prepared by Verdence Capital Advisors, LLC (“VCA” or “we”, “our”, “us”). VCA believes the information and data in this document were obtained from sources considered reliable and correct and cannot guarantee either their accuracy or completeness. VCA has not independently verified third-party sourced information and data. Any projections, outlooks or assumptions should not be construed to be indicative of the actual events which will occur. These projections, market outlooks or estimates are subject to change without notice. This material is being provided for informational purposes only and is not intended to provide, and should not be relied upon for, investment, accounting, legal, or tax advice. Past performance is not a guarantee of future results. Different types of investments involve varying degrees of risk, and there can be no assurance that the future performance of any specific investment, investment strategy, or product or any non-investment related content, made reference to directly or indirectly in these materials will be profitable, equal any corresponding indicated historical performance level(s), be suitable for your portfolio or individual situation, or prove successful. You should not assume that any discussion or information contained in this report serves as the receipt of, or as a substitute for, personalized investment advice from VCA. Alternative investments are designed only for sophisticated investors who are able to bear the risk of the loss of their entire investment. Investing in alternative investments should be viewed as illiquid and generally not readily marketable or transferable. Investors should be prepared to bear the financial risks of investing in an alternative investment for an indefinite period of time. Due to various factors, including changing market conditions and/or applicable laws, the content may no longer be reflective of current opinions or positions. All indexes are unmanaged, and you cannot invest directly in an index. Index returns do not include fees or expenses. Sector Watch Use of this website is intended for U.S. residents only. Any recommendation, opinion or advice regarding securities or markets contained in such material does not reflect the views of Verdence Capital, and Verdence Capital does not verify any information included in such material. Verdence Capital assumes no responsibility for any fact, recommendation, opinion, or advice contained in any such research material and expressly disclaims any responsibility for any decisions or for the suitability of any security or transaction based on it. Any decisions you may make to buy, sell, or hold a security based on this research will be entirely your own and not in any way deemed to be endorsed or influenced by or attributed to Verdence Capital. It is understood that, without exception, any order based on such research that is placed for execution is and will be treated as an UNRECOMMENDED AND UNSOLICITED ORDER. Further, Verdence Capital assumes no responsibility for the accuracy, completeness, or timeliness of any such research or for updating such research, which is subject to change without notice at any time. Verdence Capital does not provide tax, or legal advice. Under no circumstance is the information contained within this research to be used or considered as an offer to sell or a solicitation of an offer to buy any particular investment/security. Fixed income securities are subject to increased loss of principal during periods of rising interest rates. Fixed income investments are subject to various other risks including changes in credit quality, market valuations, liquidity, prepayments, early redemption, corporate events, tax ramifications and other factors. Lower rated securities are subject to greater credit risk, default risk, and liquidity risk. Commodity‐related products, including futures, carry a high level of risk and are not suitable for all investors. Commodity‐related products may be extremely volatile, illiquid and can be significantly affected by underlying commodity prices, world events, import controls, worldwide competition, government regulations, and economic conditions, regardless of the length of time shares are held. Data is provided for information purposes only and is not intended for trading purposes. Verdence Capital shall not be liable for any errors or delay in the content, or for any action taken in reliance on any content. Weekly Insights/Qtrly & Annual Outlook The indexes presented are unmanaged portfolios of specified securities and do not reflect any initial or ongoing expenses nor can it be invested in directly. An investment’s portfolio may differ significantly from the securities in the index. Semi-Annual Chart Pack Where shown, performance information presented is that which has been calculated and presented by an unaffiliated third-party manager. We have no insight into the performance of the advisor/product/account or fund shown and do not attempt to determine whether the performance presented is accurate. Therefore, the performance could be incorrect, overstated or not reflective of actual trading of client funds. There is the potential that the performance shown is a back test and not the result of real investment advice and trading. As such, it could not be relied upon as indicative of future returns of a particular strategy. Where performance shown is that of a pooled account, limited partnership, or private equity fund, you should be aware that there is a significant lack of transparency into the operations and investment process and investment vehicles invested in. As a result, pricing and valuation of the underlying holdings which produced the stated performance could be incorrect, stale, or overstated and therefore the performance figures presented cannot be relied upon. Before investing, we encourage you to request additional information, particularly performance information, of any product that you are considering for your client. You should read, as applicable, the Prospectus, SAI, Composite Disclosure and/or performance disclosure associated with any product that you are considering for investment for your or your client’s. Products shown may have minimum account sizes or minimum investments which may preclude retail and non-high net worth investors from being able to invest in these products. You should be aware that certain LPs may be closed to new investors and therefore your clients may be prevented from investing in these products. Portfolio Implementation and Rationales The SMA Asset Allocation Models do not represent a personalized recommendation of a particular investment strategy to you or your clients. You should not buy or sell an investment without first considering whether it is appropriate for your client’s portfolio. Additionally, you should review and consider any recent market news. All expressions of opinion are subject to change without notice in reaction to shifting market conditions. Data contained herein from third-party providers is obtained from what are considered reliable sources. However, its accuracy, completeness or reliability cannot be guaranteed. Supporting documentation for any claims or statistical information is available upon request. Examples provided are for illustrative purposes only and not intended to be reflective of results you can expect to achieve. Diversification and asset allocation do not ensure a profit and do not protect against losses in declining markets. Any forecasts contained herein are for illustrative purposes only, may be based upon proprietary research and are developed through analysis of historical public data. Investments in growth stocks may experience price volatility due to their sensitivity to market fluctuations and dependence on future earnings expectations. Sector allocation references to market capitalization (“smid cap” or “micro caps” etc.) may be subject to special risks given their characteristic narrow markets, limited financial resources, and less liquid stocks, all of which may cause price volatility. International/global investing can involve special risks, such as political changes and currency fluctuations. These risks are heightened in emerging markets. A significant percentage of the underlying investments in aggressive asset allocation portfolio investments have a higher-than-average risk exposure. You should consider your risk tolerance of each of your clients carefully before choosing such a strategy. An investment with multiple underlying investments (which may include asset-allocation or custom blended investments) may be subject to the expenses of those underlying investments in addition to those of the investment itself. Investments may reside in the specialty category due to 1) allowable investment flexibility that precludes classification in standard asset categories and/or 2) investment concentration in a limited group of securities or industry sectors. Investments in this category may be more volatile than less flexible and/or less concentrated investments and may be appropriate as only a minor component in an investor’s overall portfolio. Investment Managers You and your clients should carefully consider investment objectives, risks, charges, and expenses of Funds discussed. This and other important information are contained in the respective Fund prospectuses and summary prospectuses, which should be read carefully before investing. Investment portfolio statistics change over time. Current performance may be lower or higher than return data quoted herein. The investment return and the principal value of an investment will fluctuate; so, an investor’s shares/units, when redeemed, may be worth more or less than their original cost. Verdence relies heavily on unaudited third-party data. Data sources include public data, such as mutual fund data, and non-public data, such as information provided by other investment advisors and managers of limited partnership pooled accounts. Data and/or statistics included on this Portal, including references to performance, opinions, ratings, rankings, manager statistics and demographic information, product, or strategy descriptions, either quantitative or qualitative, are based upon information reasonably available to us as of the applicable date(s) then-published. Information has been obtained from sources that we believe to be reliable, but these sources cannot be guaranteed as to their accuracy or completeness. All data and information produced by a third party has the potential to be incorrect, incomplete, or otherwise misleading. No implication shall be created that the information contained on the Site is correct, including as of any time subsequent to the publish date, and Verdence does not undertake an obligation to update such information at any time after such date. Verdence makes not warranty or representation of the veracity of the data and information and its use of the information should not be implied as an endorsement of any material or statements made. Data, particularly non-public data, is subject to error and where the information is not audited, the potential for error is greater. Where shown, performance information presented is that which has been calculated and presented by an unaffiliated third-party manager. We have no insight into the performance of the advisor/product/account or fund shown and do not attempt to determine whether the performance presented is accurate. Therefore, the performance could be incorrect, overstated or not reflective of actual trading of client funds. There is the potential that the performance shown is a back test and not the result of real investment advice and trading. As such, it could not be relied upon as indicative of future returns of a particular strategy. Where performance shown is that of a pooled account, limited partnership, or private equity fund, you should be aware that there is a significant lack of transparency into the operations and investment process and investment vehicles invested in. As a result, pricing and valuation of the underlying holdings which produced the stated performance could be incorrect, stale, or overstated and therefore the performance figures presented cannot be relied upon. Before investing, we encourage you to request additional information, particularly performance information, of any product that you are considering for your client. You should read, as applicable, the Prospectus, SAI, Composite Disclosure and/or performance disclosure associated with any product that you are considering for investment for your or your client’s. Certain products shown may have account minimums or minimum investment sizes that are unattainable for your clients and therefore they may not be eligible to invest in these products. Reference to registration with the Securities and Exchange Commission (“SEC”) does not imply that the SEC has endorsed or approved the qualifications of Verdence or its respective representatives to provide any advisory services described on the Site.

Read more